The NMR line intensity, which depends on the various interactions involved during the RF (無線電波) pulses, is proportional to the amplitude of the first sampled point of a free-induction decay (自由感應衰變) or the integrated area of the corresponding spectrum (光譜). In theoretical studies of half-integer (半奇數) quadrupole spins, usually only the static first-order quadrupole interaction is taken into account during the RF pulses. This interaction represents the coupling of the nuclear electric quadrupole moment eQ with the electric-field gradient (EFG) generated by the surroundings of a nucleus.
In the high magnetic field condition, the central line of a half-integer quadrupole spin has a featureless lineshape (線形). As a result, lineshape analysis is not suitable for determining the two quadrupole parameters: the quadrupole coupling constant and the asymmetry parameter. The first-order quadrupole interaction and the quadrupole coupling ωQ are defined respectively by

The quadrupole coupling is defined experimentally by half the frequency separating two consecutive lines of a single crystal (單晶). It is half that used by A. Abragam. The quadrupole coupling constant is QCC = e2qQ/h. In other words, the line intensity depends on the ratio (比) of the QCC to the amplitude ωRF of the RF pulse for a powder, or the ratio ωQ/ωRF for a single crystal. However, there is a lower limit to these ratios above which the line intensity does not change any more. Conversely, fitting a series of nutation NMR line intensities for an increasing pulse length (脈衝長度) allows us to determine the quadrupole coupling.

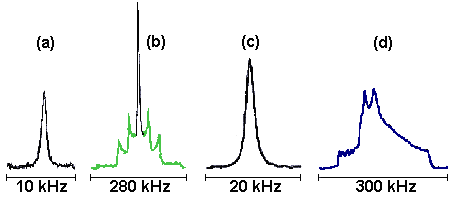
The quadrupole coupling constant (QCC) increases from Fig. (a) to Fig. (d). The spectrum width is shown below each spectrum. In Fig. (a), QCC = 1 kHz, therefore all the single-quantum coherences are observed as a single line located at the Larmor frequency.
As the QCC increases, the first-order quadrupole interaction becomes observable as in Fig. (b) with a spin I = 5/2 system: the central line (black line) remains at the Larmor frequency but the satellite lines appear as a powder pattern (green part). From the latter, we can deduce that the asymmetry parameter is equal to zero and QCC = 300 kHz.
When the QCC increases further, the satellite powder pattern spreads over MHz rang and becomes unobservable. Only the central line is detected as in Fig. (c) with QCC = 1 MHz. It is worth noting that Figs. (a) and (c) have a featureless lineshape.
Finally, for a large QCC, even the central line is broadened but this time by the second-order quadrupole interaction. Figure (d) is the central line whose shape is well characterized with an asymmetry parameter = 0.7 and QCC = 18 MHz.
In order to determine the quadrupole coupling constant from a featureless NMR lineshape (Figs. (a) and (c)), we apply the nutation NMR approach. The references containing data and graphs that can be simulated with the various Java applets of the site are classified according to the sequence.
The numerical values of the physical parameters in the applets are preset for a spin I = 3/2 and the central line located at the Larmor frequency is always selected. For testing an applet, simulated "experimental" line intensities are provided in each applet. Therefore, you only need to press the buttons in the following order:
- Pressing the RUN button calculates the theoretical line intensities.
- Pressing the FIT button changes it to the STOPFIT button and starts fitting the experimental line intensities by theoretical curve.
- Pressing the STOPFIT button changes it to the FIT button and stops the fit.
- Pressing the PREVIOUS button returns to the simulation panel.
From a practical point of view, you should introduce your experimental data and line intensities to use the fitting part of these applets. You can always use the simulation part of these applets to check the graphs that are in the papers provided in the reference part.
