Fitting the nutation NMR line intensity

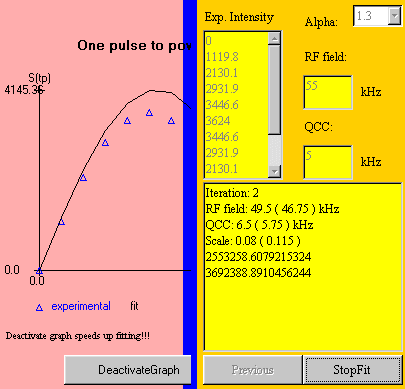
After pressing the FIT button, the fitting panel appears. The curve is plotted with the package "Graph" from J. Bishop and N. Bishop. The text-area shows the evolution of the estimated parameters
RF field: two values expressed in kHz, one of which is in parentheses
QCC (for powder) or OmegaQ (for crystal): two values expressed in kHz, one of which is in parentheses
Scale: two ratios of the experimental line intensity to the simulated line intensity, one of which is in parentheses
The last two numbers should decrease towards the same value
Pressing the:
- DEACTIVATEGRAPH button changes it to the ACTIVATEGRAPH button and speeds up the fitting procedure for a crystal;
- ACTIVATEGRAPH button changes it to the DEACTIVATEGRAPH button and shows the fitting of the experimental line intensities by the theoretical curve;
- STOPFIT button changes it to the FIT button and stops the fitting procedure;
- PREVIOUS button returns to the simulation panel.
