AIM: Determination of the quadrupole coupling from a featureless NMR lineshape
Launch the Hahn echo applet with Java Web Start.

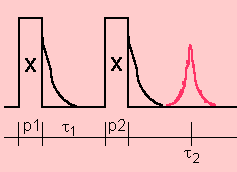
In the basic two-pulse Hahn echo sequence on half-integer quadrupole spins, the single-quantum coherences generated by the first pulse are refocused as echoes by the second pulse. The observation of these echoes, located at tau2 = tau1, requires the optimization of the two pulse-lengths p1 and p2.
An echo amplitude is a product of two functions. The first function A(p1), called the excitation function, depends on p1. The second function B(p2), called the conversion function, depends on p2.

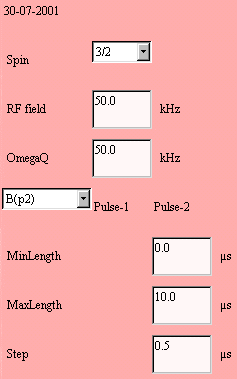
The left part of the simulation panel indicates the physical parameters. It is preset for a typical experiment on a spin I = 3/2. You can introduce your own values.
First, we should select with the choice box one of the three types
of calculation available:
(1) A(p1)B(): the echo amplitude when p1 is variable and
p2 is constant;
(2) A()B(p2): the echo amplitude when p1 is constant and
p2 is variable;
(3) B(p2): the conversion function.
The first two cases could be checked experimentally, whereas the last
case is a theoretical result.
When a pulse length is constant, it should be provided in the MinLength field.
MinLength: the first variable pulse-length in µs
MaxLength: the last variable pulse-length in µs
Step: the increment of the variable pulse-length in µs
Then, we select the observed coherence, shown in the text-area above the RUN button.
The following applet is initialized for the conversion function of the central-transition Hahn echo amplitude B(p2) of a spin I = 3/2 in a single crystal. The experimental line intensities are identical to the simulated ones.
Help for selecting all the simulated data of the line intensity text area in a JDK1.1.8 applet.
