7 - Shearing 2D map
Shearing consists in applying a phase correction of +k*IN6 to the 2D echo map and a phase correction of -k*IN6 to the 2D anti-echo map before the F1 Fourier transform. For aluminum-27 and 3QMAS experiment, k = 19/12.
The final 2D MQMAS spectrum will display isotropic peaks along the F1 dimension and their anisotropic MAS line shape along the F2 dimension.
(1) We recall the three echo files by selecting the menu items:
Data/echo
(2) We set the value of the phase correction by selecting the menu items:
Process/Phase/Parameters...

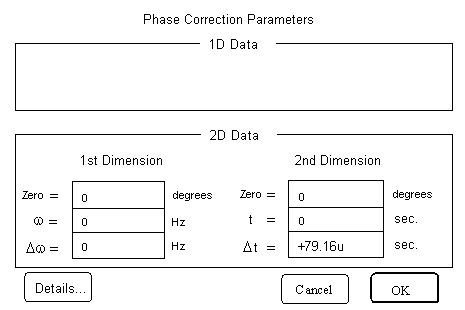
The form of Phase Correction Parameters appears. In its 2nd Dimension of 2D Data area, we set the text fields Zero and t to 0 and the text field delta t to +79.16u. This value is that of +k*IN6, u stands for microsecond.
(3) We perform the shearing or phase correction by selecting the menu items:
Process/Phase/Phase Correct

Figure 1
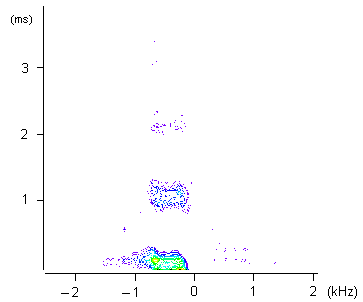
Intensity plot of the sheared 2D echo map:
The horizontal axis is labeled in frequency unit.
The vertical axis is labeled in time unit.
We repeat the above procedure with the anti-echo files. The only change is the sign of the value of delta t: -79.16u corresponding to -k*IN6.

Figure 2
Intensity plot of the sheared 2D anti-echo map:
The horizontal axis is labeled in frequency unit.
The vertical axis is labeled in time unit.
