4 - Echo file
For aluminum-27 (I = 5/2), which has a positive gyromagnetic ratio, and for 3QMAS experiment performed with the two-pulse program, the echo fecho(t1, t2) signal is related to the cosine Scos(t1, t2) and sine Ssin(t1, t2) signals by:
fecho(t1, t2) = Scos(t1, t2) + i*Ssin(t1, t2) .
To get i*Ssin(t1, t2) from Ssin(t1, t2), we must introduce the complex number i, performed in fact with a phase correction.
(1) We add a 90°-phase shift to the sin file by selecting the menu items:
Process/Phase/Parameters...

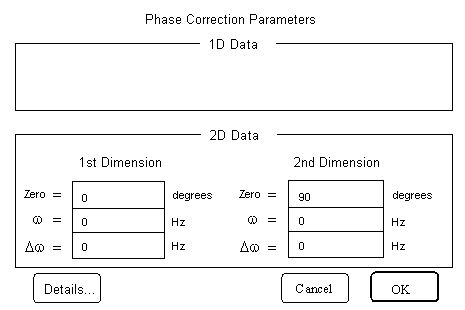
The Phase Correction Parameter form appears. In the text field Zero of 2nd Dimension of 2D Data area, we type 90. The other fields are zeroed.
(2) We apply the i-phase correction by selecting the menu items:
Process/Phase/Phase Correct
We obtain exp(i*Pi/2)*Ssin(t1, t2), that is, i*Ssin(t1, t2).

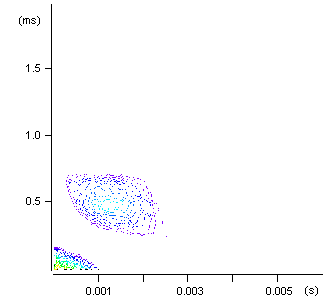
Figure 1 Intensity plot of the i-phase corrected
sine file of 2D MQMAS data:
Both axes of the 2D map are labeled in time units.
(3) We add the Scos(t1, t2) file to i*Ssin(t1, t2) file to build the echo file fecho(t1, t2) by selecting the menu items:
Data/Add Data...

A window appears, in which we add sin to cos. (The two shadowed rectangles are in fact pop-up lists of filenames, clicking on them allows us to choose files.) We save the resulting file with echo filename.
Three 2D files corresponding to the 2D echo MQMAS data appear on the desktop:
- echo -> 2D Data - Stacked Plot
- echo -> 2D Data - Line Contour Plot
- echo -> 2D Data - Intensity Plot

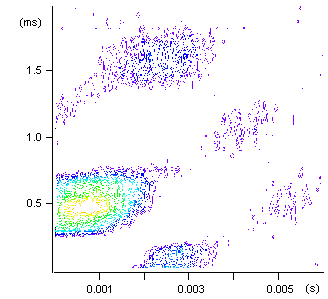
Figure 2
Intensity plot of the 2D echo MQMAS data:
Both axes of the 2D map are labeled in time units.
