5 - Anti-echo file
For aluminum-27 (I = 5/2), which has a positive gyromagnetic ratio, and for 3QMAS experiment performed with the two-pulse program, the antiecho fanti-echo(t1, t2) signal is related to the cosine Scos(t1, t2) and sine Ssin(t1, t2) signals by:
fanti-echo(t1, t2) = Scos(t1, t2) - i*Ssin(t1, t2) .
To get -i*Ssin(t1, t2) from i*Ssin(t1, t2) obtained previously for the echo signal, we apply a phase shift of 180° to i*Ssin(t1, t2).
(1) To this end, we recall the sin files by selecting the menu items:
Data/sin
(2) We perform twice a 90°-phase correction, that is, we select twice the menu items:
Process/Phase/Phase Correct
We obtain exp(i*Pi/2)*exp(i*Pi/2)*i*Ssin(t1, t2), that is, -i*Ssin(t1, t2).

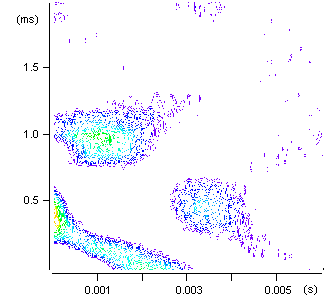
Figure 1
Intensity plot of the -i-phase corrected sine file of 2D MQMAS data:
Both axes of the 2D map are labeled in time units.
(3) We add the Scos(t1, t2) file with -i*Ssin(t1, t2) file to build the anti-echo file fanti-echo(t1, t2) by selecting the menu items:
Data/Add Data...

A window appears, in which we add sin to cos. (The two shadowed rectangles are in fact pop-up lists of filenames, clicking on them allows us to choose files.) We save the resulting file with antiecho filename.
Three 2D files corresponding to the 2D anti-echo MQMAS data appear on the desktop:
- antiecho -> 2D Data - Stacked Plot
- antiecho -> 2D Data - Line Contour Plot
- antiecho -> 2D Data - Intensity Plot

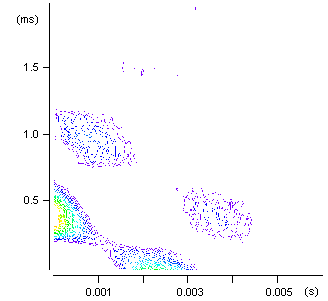
Figure 2
Intensity plot of the 2D anti-echo MQMAS data:
Both axes of the 2D map are labeled in time units.
