3 - Separate interleaved data
In the hypercomplex 2D acquisition procedure, two files acquired in the simultaneous mode are generated by the quadrature detection acquisition in the F1 dimension. The first file is equivalent to the cosine part of a free-induction decay (FID); the second file is equivalent to the sine part of a FID.

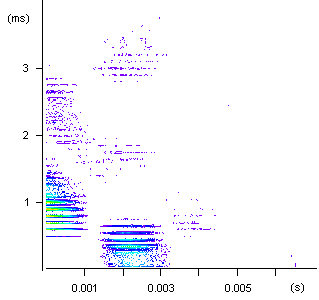
Figure 1 Intensity plot of imported
but still interleaved 2D MQMAS map acquired in the simultaneous mode:
Both axes of the 2D map are labeled in time units.
(1) We start separating the interleaved data by selecting the menu items:
Data/Separate Interleaved Data...

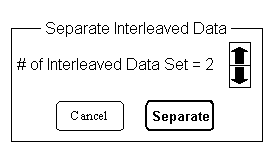
We accept the default value of 2 in the Separate Interleaved Data panel by clicking on the Separate button.
(2) The program prompts us with a save-file dialog window. We name the first file cos.
Three 2D files of cos appear on the desktop:
- cos -> 2D Data - Stacked Plot
- cos -> 2D Data - Line Contour Plot
- cos -> 2D Data - Intensity Plot

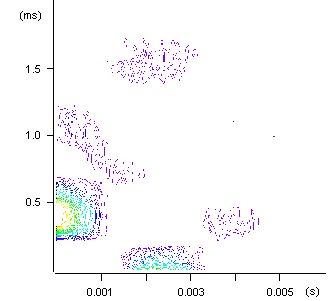
Figure 2 Intensity plot of the cosine file
called cos, separated from the interleaved data:
Both axes of the 2D map are labeled in time units.
(3) The program prompts us with a second save-file dialog window. We name the second file sin.
Three 2D files of sin appear on the desktop:
- sin -> 2D Data - Stacked Plot
- sin -> 2D Data - Line Contour Plot
- sin -> 2D Data - Intensity Plot

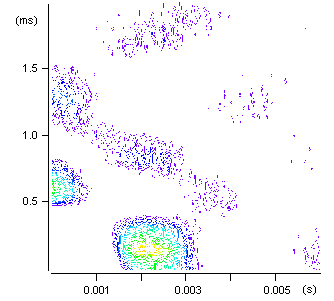
Figure 3 Intensity plot of the sine file
called sin, separated from the interleaved data:
Both axes of the 2D map are labeled in time units.
