*** Outline ***
(A) Harmonic inversion for improving spectrum resolution
- Harminv:
a free program
(and accompanying C library) to solve the problem of harmonic inversion: decomposing
a time-series into a sum of sinusoids, including exponentially decaying sinusoids
This program is described in Linear prediction with SVD and harmonic inversion methods. - Download (last updated 16 March 2010) Java application harmonic_inversion.jar on the desktop.
- Download Java application nmrsvd2.jar on the desktop. This application is described in New Java application for FID denoising with SVD.
- The two Jython scripts filereader.py and filewriter.py are described in Java application for FID denoising with SVD.
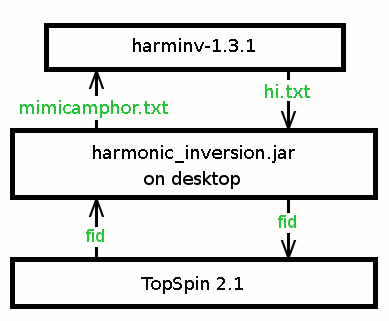
fid is a 4-octet integer binary file.
(B) Harmonic inversion processing procedure
There are three main steps in the procedure for improving spectrum resolution:
Preparation step: Denoise the truncated FID if the signal to noise ratio is low (see 3)
Step 1: Generate the input file for Harminv (see 4);
Step 2: Process this input file with Harminv (see 5);
Step 3: Generate an FID file with the output of Harminv (see 6 and 7).
- Original data file
✱ In TopSpin, process the file C13CP-camph-4BL 4 (TD = 4996, dwell time DW = 0.02 msec, acquisition time AQ = 0.09999 s) by convdta command. (Its TopSpin file 4.zip).
✱ Save it as C13CP-camph-4BL 1000.
✱ Display C13CP-camph-4BL 1000 (TD = 4996; due to convdta processing, the number of visible points on the screen is 4858. Enter tdeff 4996 in the command line of TopSpin, then enter tdeff a second time. TopSpin shows: Number of fid data points used by ft: TDeff = 4858).
✱ Generate a shortcut of C13CP-camph-4BL folder on the desktop for TopSpin folder navigation.
✱ Comments: The well known definition of the acquisition time AQ of an FID is related to the number of time-domain data points TD and the dwell time DW of the FID by:
AQ = TD*DW
From mathematical point view, the complex points of an FID are sampled simultaneously and TD is therefore the number of complex points of an FID.
In TopSpin, TD is the number of real sampled points plus the number of imaginary sampled points. In other words, TD is twice the number of complex points of an FID. To maintain AQ value unchanged, DW is divided by two. In this example, TopSpin uses DW = 0.02 msec instead of DW = 0.04 msec.
- For demonstration only, FID data with shorter AQ
✱ Save a copy of C13CP-camph-4BL 1000 as C13CP-camph-4BL 2000 with wrpa command.
✱ Display C13CP-camph-4BL 2000.
✱ Reduce the number of experimental complex points of C13CP-camph-4BL 2000 to TDeff/2 = 2430.
(1) Set TDeff to 2430; but TD = 4996.
(2) Enter the Jython script name filereader.py in the command line. Wait...
(3) Rename the noisy.txt file as denoised.txt in the folder of C13CP-camph-4BL 2000.
(4) Enter the Jython script name filewriter.py in the command line. Wait...
(5) Display C13CP-camph-4BL 2000 (TD = TDeff = 2430). The FID is shortened by half. - FID denoising with SVD Java application nmrsvd2.jar
✱ Save a copy of C13CP-camph-4BL 2000 as C13CP-camph-4BL 3000 with wrpa command.
✱ Open nmrsvd2.jar.
(1) Select menu item File > Open binary file...
(2) Select the binary fid file of C13CP-camph-4BL 3000.
(3) The two textField show TDeff/ 2 = TD/2 = 1280; set TDeff/2 = 1215.Figure 1: Java application nmrsvd2.jar panel.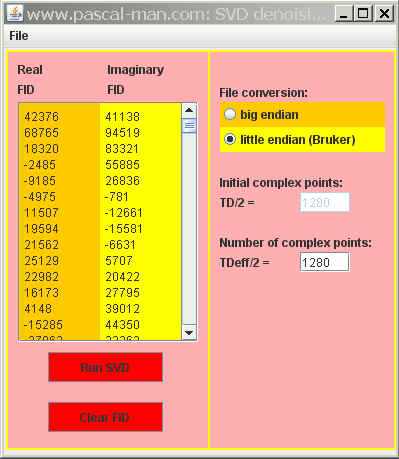
(4) Click Run SVD button. Wait. Use 10 SVD values. Click Hankel button. Wait.
(5) Select menu item File > Save as binary...
(6) Save the file as binary fid file.
(7) Display C13CP-camph-4BL 3000; set TDeff = 0 before Fourier transform. - Generate input data file for Harmonic inversion program Harminv
✱ Save a copy of C13CP-camph-4BL 3000 as C13CP-camph-4BL 4000 (TD = 2430) with wrpa command.
✱ Open Java application harmonic_inversion.jar
(1) Select menu item FID > Open binary file...
(2) Select the binary fid file of C13CP-camph-4BL 4000.
(3) Enter 1215 complex points into TD/2 textField. This will delete zero numbers at the end of the FID.Figure 2: Java application harmonic_inversion.jar panel.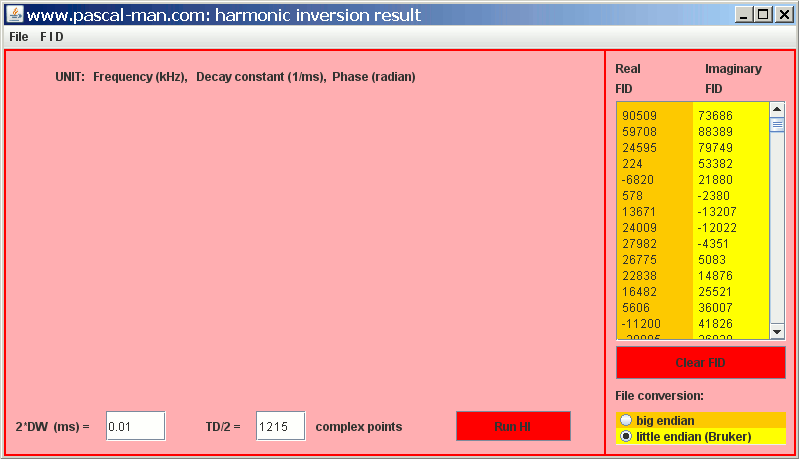
(4) Select menu item FID > Save as a+bi ASCII file for harminv...
(5) Provide the filename mimicamphor.txt and save it on the desktop.✱ Move the file mimicamphor.txt from desktop into the folder of harminv-1.3.1.
- Execution of Harminv in Cygwin:
✱ The dwell time is that from TopSpin, DW = 0.02 msec. As a result, the frequencies provided by harminv-1.3.1 are twice that expected, in addition to the change of signs.
Figure 3: Running harminv program with input file mimicamphor.txt and result in Cygwin window.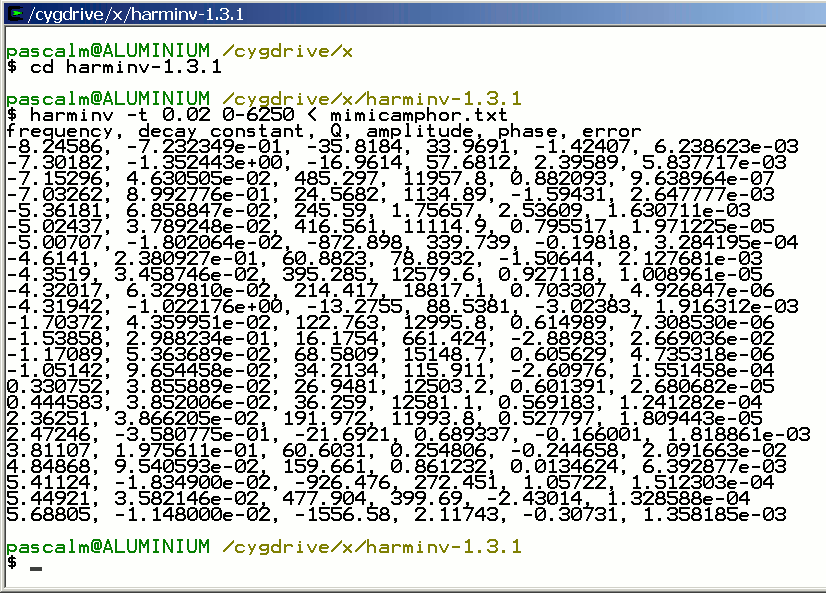
- Generate C13CP-camph-4BL 4000 file with longer AQ
✱ Select and copy the numerical data in Cygwin window; then paste them in MS Bloc-notes as a text file called hi.txt on the desktop.
✱ Open Java application harmonic_inversion.jar
(1) Select menu item File > Open ASCII harmonic inversion result file...
(2) Select the ASCII file hi.txt from the desktop.
(3) Press Shift key and click the column header "Amplitude" to sort the data.
(4) Select the first nine lines of the spreadsheet (they have low errors and small decay constants).
(5) Fill the field 2*DW with 0.02 (the same value used in Harminv), the number of complex data field with TD/2 = 4996 value.
(6) Click Run HI button. Wait...Figure 4: Java application harmonic_inversion.jar panel.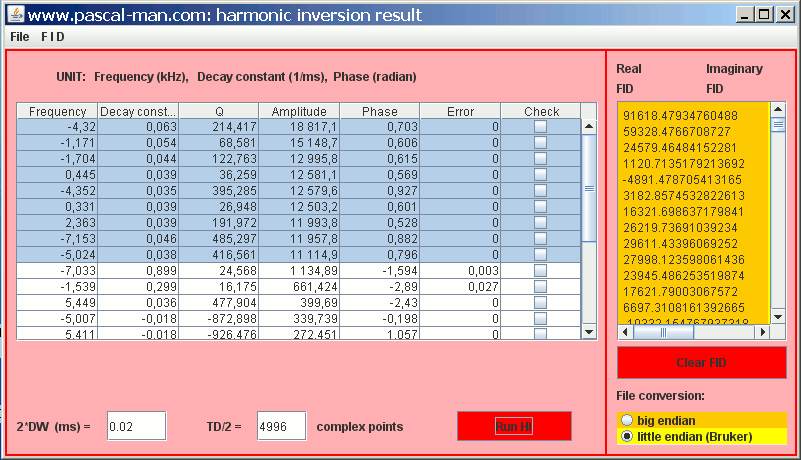
✱ The simulated FID data appear in the two textArea.
(1) Select menu item FID > Save as binary file...
(2) Select the binary fid file of C13CP-camph-4BL 4000. - Display C13CP-camph-4BL 4000
✱ Increase the TD values in TopSpin acqu and acqus files to TD = 9992 in C13CP-camph-4BL 4000 folder.
✱ Display C13CP-camph-4BL 4000. Observe the whole FID signal.
Figure 5: 13C CPMAS spectrum of Camphor: (A) with AQ = 100 msec; (B) with AQ = 50 msec; (C) Fourier transform of SVD denoised FID of (B); (D) Fourier transform of harmonic inversion of the SVD denoised FID of (C).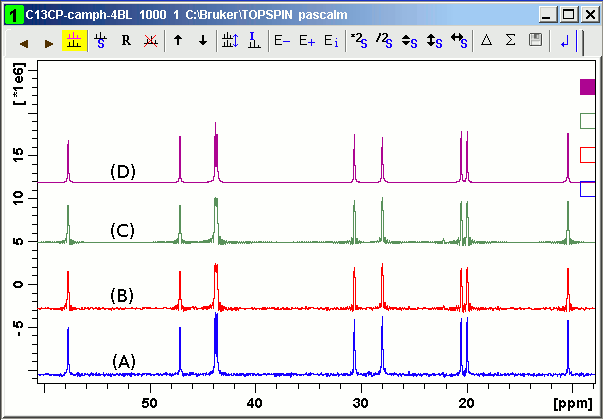
(C) Harmonic inversion test 1
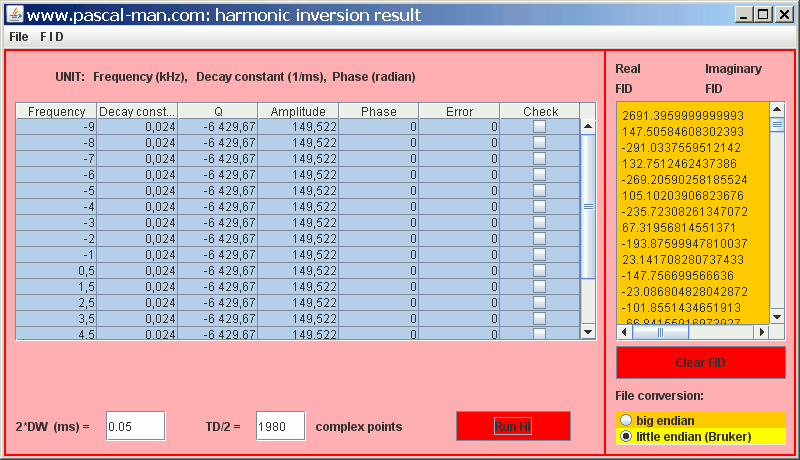
Consider 18 signals whose parameter data are contained in simul-hisilicalite7000.txt:
Frequency (kHz)    Decay constant (1/ms)    Q      Amplitude  Phase   Error
	 -9,           2.375308e-02,        -6429.67,  149.522,   0,    6.900655e-05
	 -8,           2.375308e-02,        -6429.67,  149.522,   0,    6.900655e-05
	 -7,           2.375308e-02,        -6429.67,  149.522,   0,    6.900655e-05
	 -6,           2.375308e-02,        -6429.67,  149.522,   0,    6.900655e-05
	 -5,           2.375308e-02,        -6429.67,  149.522,   0,    6.900655e-05
	 -4,           2.375308e-02,        -6429.67,  149.522,   0,    6.900655e-05
	 -3,           2.375308e-02,        -6429.67,  149.522,   0,    6.900655e-05
	 -2,           2.375308e-02,        -6429.67,  149.522,   0,    6.900655e-05
	 -1,           2.375308e-02,        -6429.67,  149.522,   0,    6.900655e-05
	  0.5,         2.375308e-02,        -6429.67,  149.522,   0,    6.900655e-05
	  1.5,         2.375308e-02,        -6429.67,  149.522,   0,    6.900655e-05
	  2.5,         2.375308e-02,        -6429.67,  149.522,   0,    6.900655e-05
	  3.5,         2.375308e-02,        -6429.67,  149.522,   0,    6.900655e-05
	  4.5,         2.375308e-02,        -6429.67,  149.522,   0,    6.900655e-05
	  5.5,         2.375308e-02,        -6429.67,  149.522,   0,    6.900655e-05
	  6.5,         2.375308e-02,        -6429.67,  149.522,   0,    6.900655e-05
	  7.5,         2.375308e-02,        -6429.67,  149.522,   0,    6.900655e-05
	  8.5,         2.375308e-02,        -6429.67,  149.522,   0,    6.900655e-05
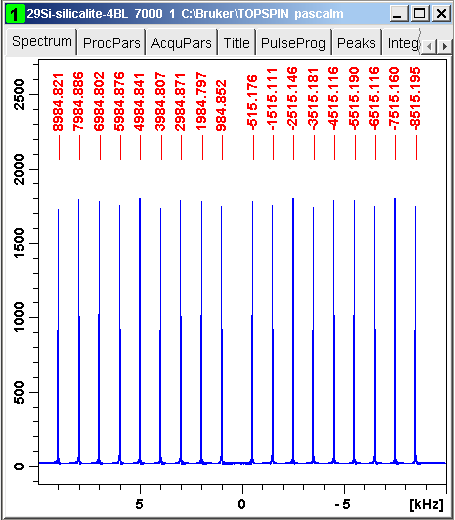
We simulate their FID signal with DW = 0.025 msec (Bruker definition) and SW = 20 kHz
Their spectrum in TopSpin:
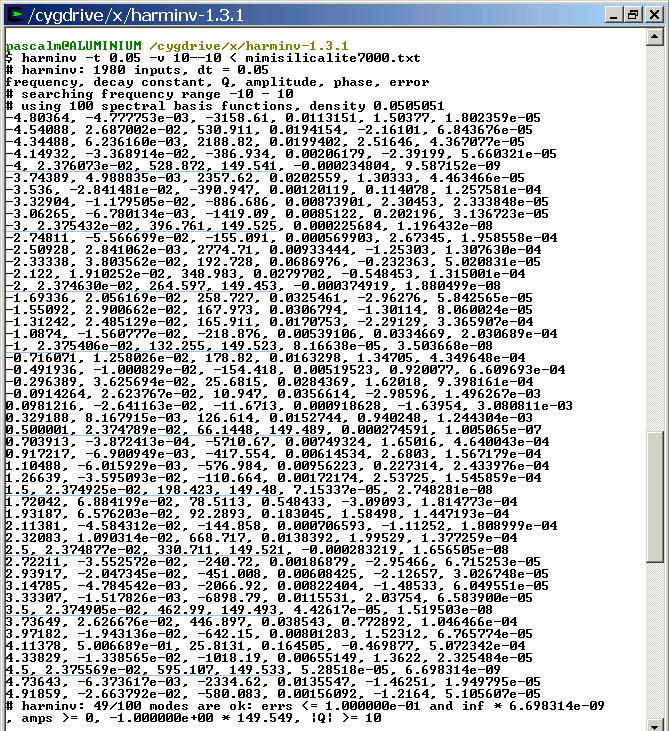
The FID data in a+bi ASCII format and saved in mimisilicalite7000.txt are analyzed with harminv-1.3.1
in ]-10 kHz, +10 kHz[ range:
harminv -t 0.05 -v 10--10 < mimisilicalite7000.txt
The FID data in a+bi ASCII format and saved in mimisilicalite7000.txt are analyzed with harminv-1.3.1
in ]0 kHz, +10 kHz[ range:
harminv -t 0.05 -v 0-10 < mimisilicalite7000.txt
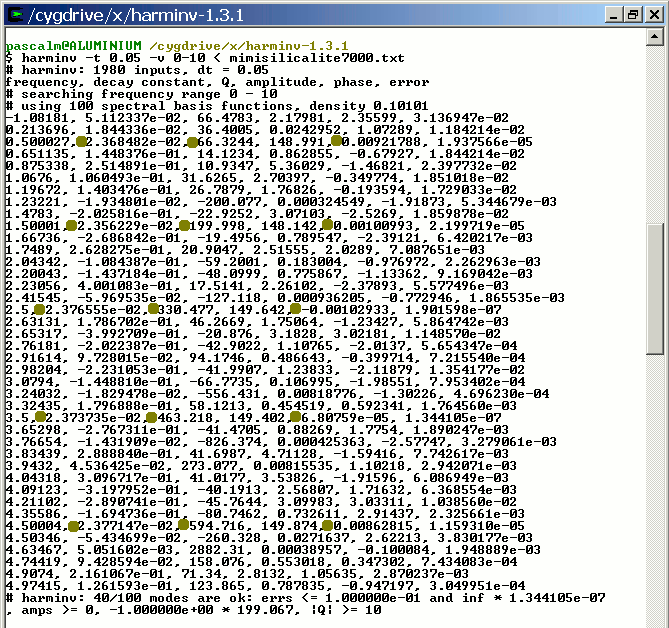
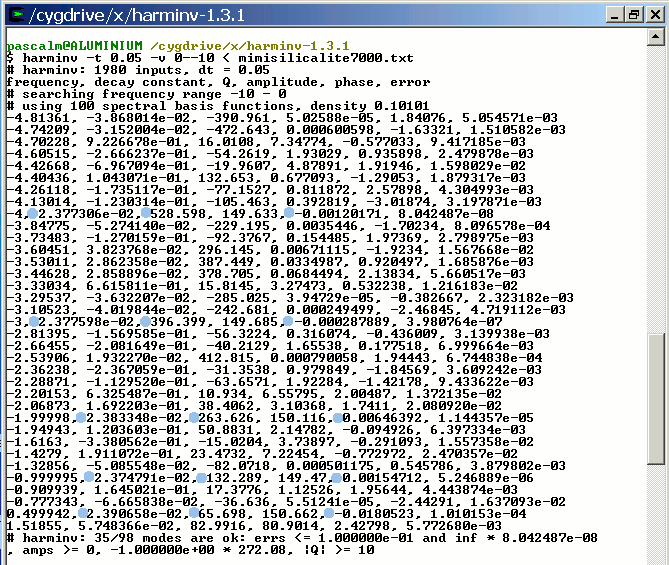
The FID data in a+bi ASCII format and saved in mimisilicalite7000.txt are analyzed with harminv-1.3.1
in ]-10 kHz, 0 kHz[ range:
harminv -t 0.05 -v 0--10 < mimisilicalite7000.txt
(D) Processing beta zeolite 29Si MAS QCPMG echo train
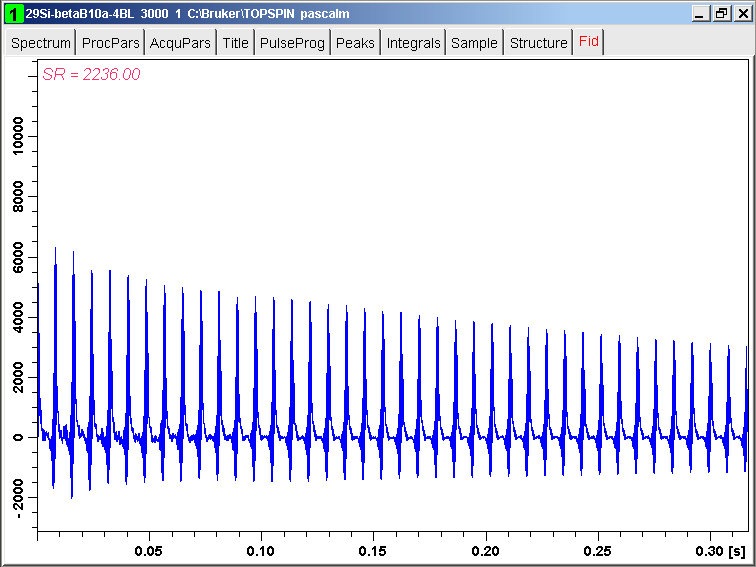
29Si QCPMG echo train of beta zeolite is acquired with the following conditions: TD = 12818, (TDeff = 12682 due to convdta command), DW = 0.025 msec (TopSpin definition), SWH = 20 kHz, and SI = 16384 (TopSpin definition), and other experimental details.
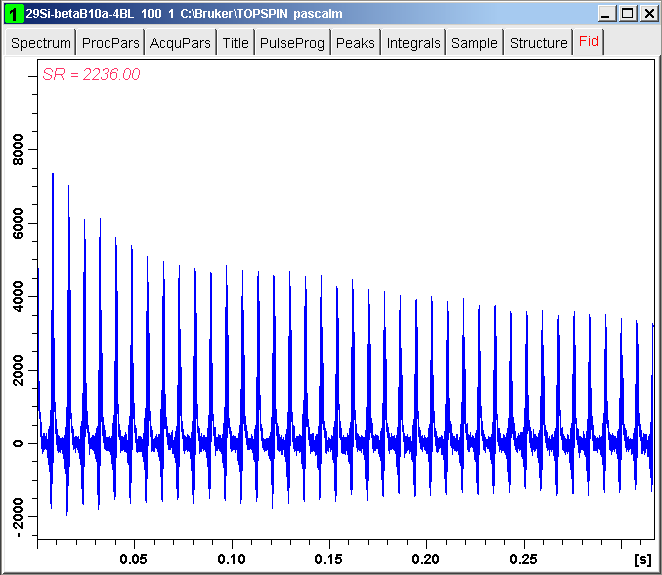
The spectrum reference SR has been changed so that the carrier frequency is located at 0 Hz. The spectrum shows that the spikelets are located in [-0.8 kHz, 1.1 kHz] range. In contrast, the spikelets are located in [-1.1 kHz, 0.8 kHz] range for harminv-1.3.1
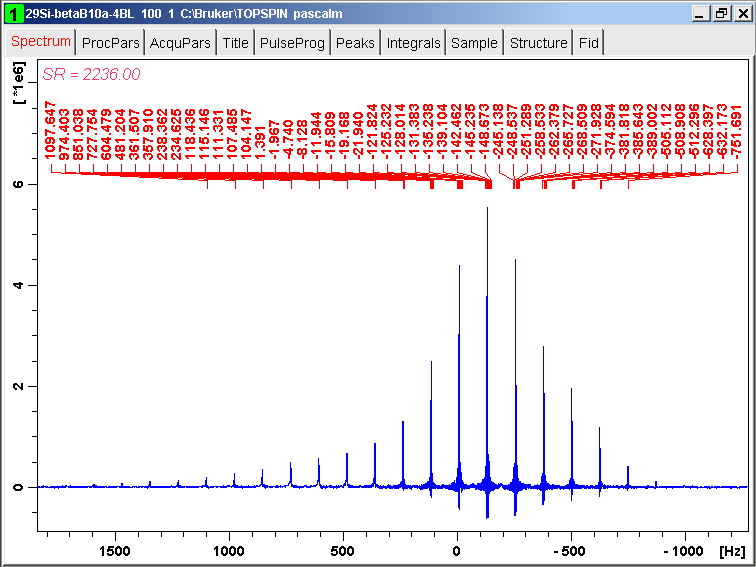
The FID data of the echo train are formatted in a+bi ASCII data with Java application harmonic_inversion.jar for treatment with harminv-1.3.1. The ASCII file is called mimibeta1000.txt
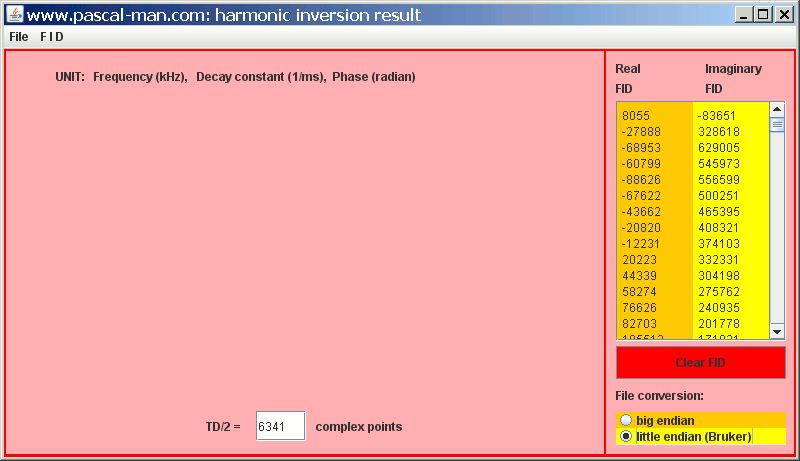
The ASCII file mimibeta1000.txt is moved into harminv-1.3.1 folder. Launch harminv program
then execute:
harminv -t 0.05 -v 0.8--0.8 < mimibeta1000.txt
For clarity, we save the output of harminv in ASCII file
hibeta1000.txt
Visualize hibeta1000.txt in Java application harmonic_inversion.jar, then select signals with amplitude higher than 1000 and with positive decay constants.
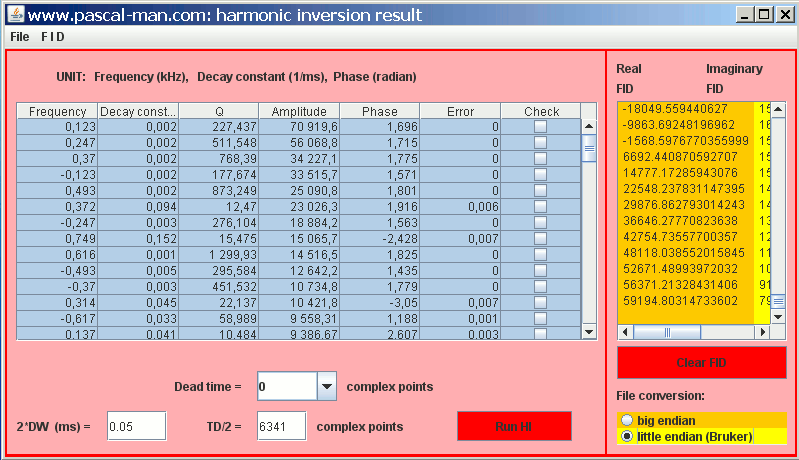
The simulated echo train and its spikelet spectrum are shown in TopSpin:
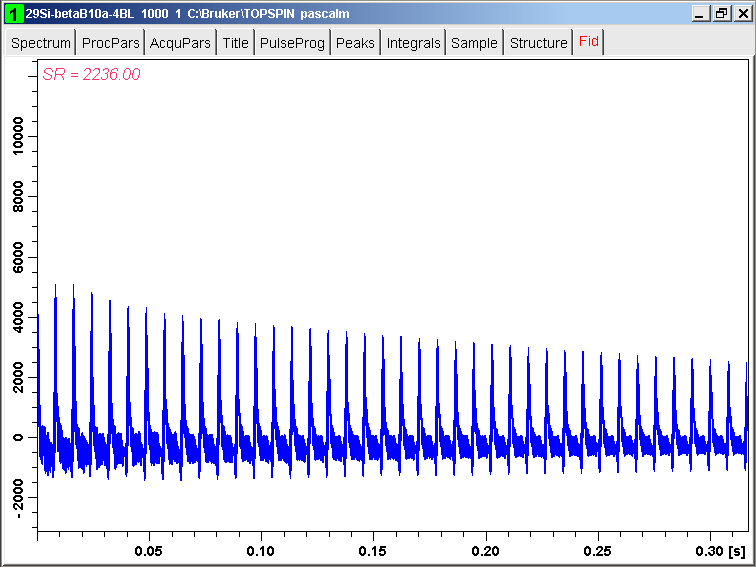
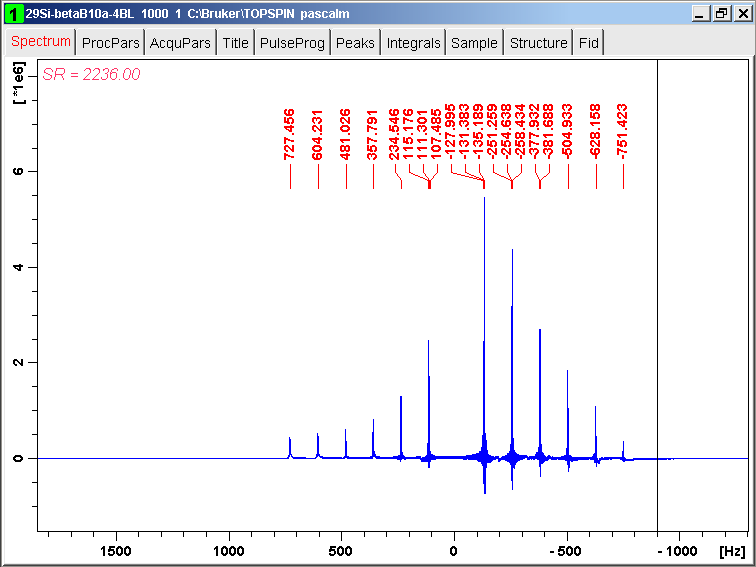
The line at about 0 Hz in the original spectrum (Figure 12)
is missing in Figure 16. The quality factor Q of this line is smaller
than 10, the default value of Q. The quality factor Q is defined by
Q = π |frequency| / decay constant
Line with Q smaller than 10 is rejected by harminv.
We execute a second simulation with harminv and a smaller value of Q = 0.001
and a wider frequency range:
harminv -t 0.05 -v -Q 0.001 0.9--1 < mimibeta1000.txt
For clarity, we save the output of harminv in ASCII file
hibeta3000.txt
The simulated echo train and its spikelet spectrum are shown in TopSpin:
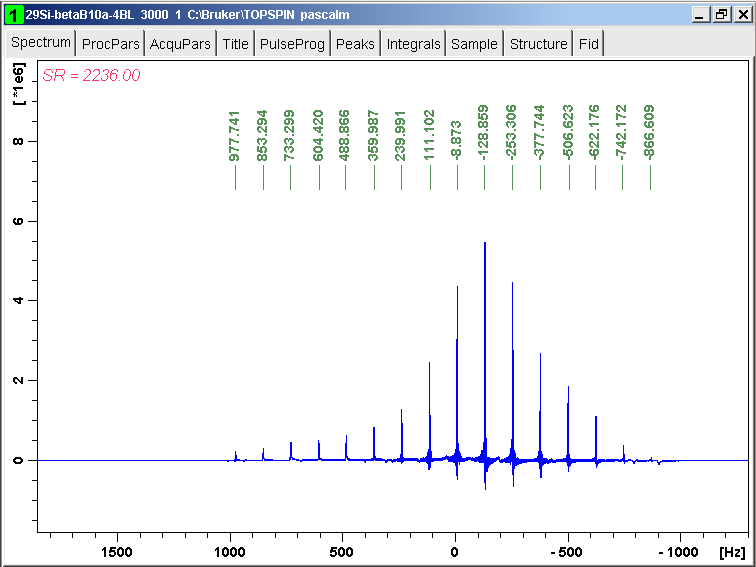
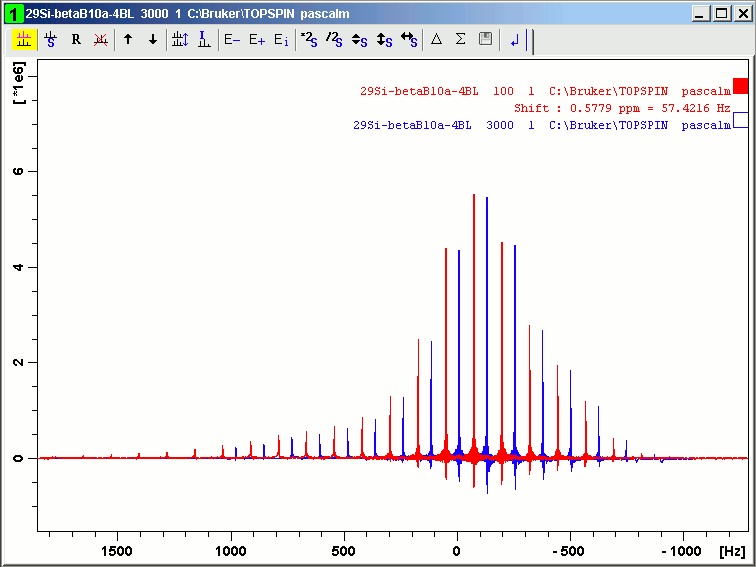
The line at about 0 Hz has been recovered.
(E) Harmonic inversion test 2 (silicalite)
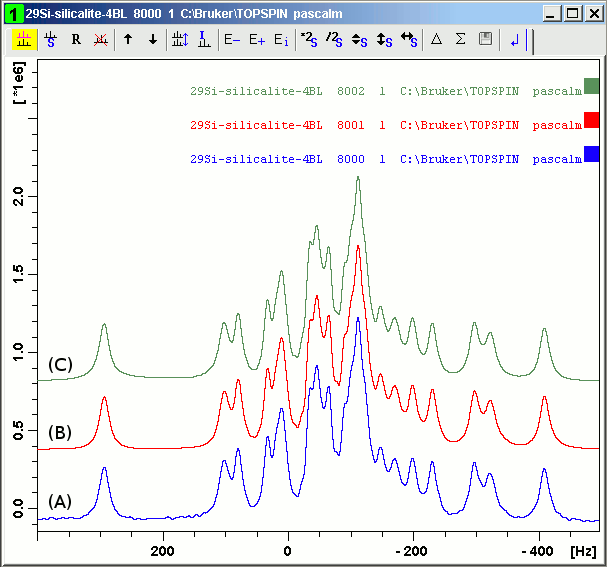
We apply harminv-1.3.1 on one-pulse silicalite 29Si MAS FID signal (its TopSpin file 30.zip, TD = 2048, TDeff = 1912, DW = 0.05 msec, SWH = 10 kHz, SI = 32768, NS = 60, D1 = 60 sec), whose FID and the corresponding spectrum are shown:
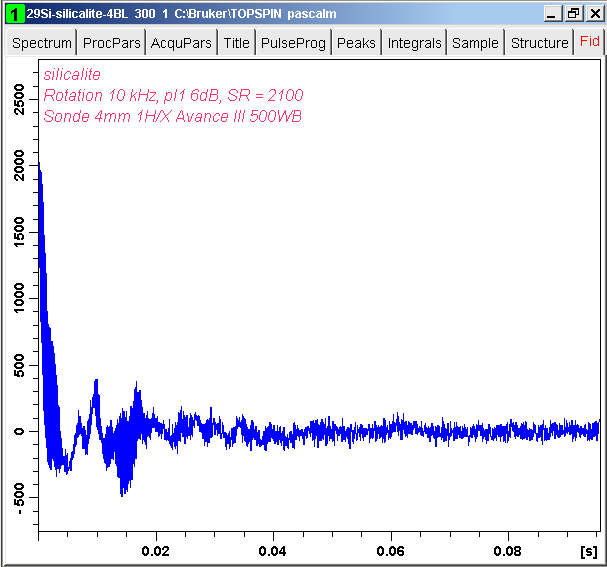
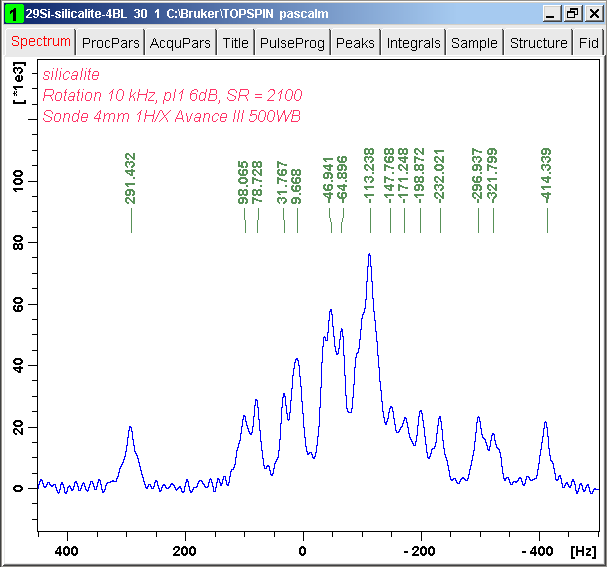
The fid in a+bi ASCII format is processed with harminv-1.3.1 several times with different frequency ranges. For simplicity, the results are gathered in a text file table. Only signals in the desired frequency range and with positive decay constants are presented.
The table shows that the desire signals are obtained with frequency ranges [0, SWH/4] and [-SWH/4, 0] or with frequency range [-SWH/4, SWH/4]. We should not limit the signal search in the desired frequency range, in the present case [-0.4 kHz, 0.5 kHz].
The signals found in the frequency ranges [0, SWH/4] and [-SWH/4, 0] are gathered in a text file called hisilicalite300total.txt.
The simulated FID (Figure 22) is obtained with harmonic_inversion.jar and hisilicalite300total.txt. The corresponding spectrum is shown in the Figure 23.
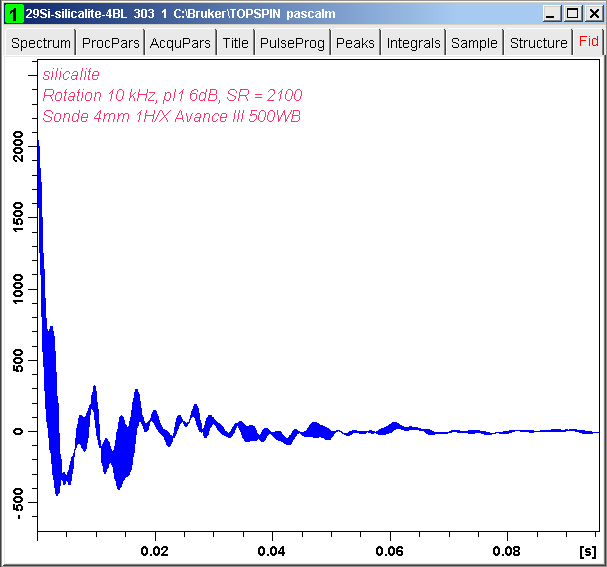
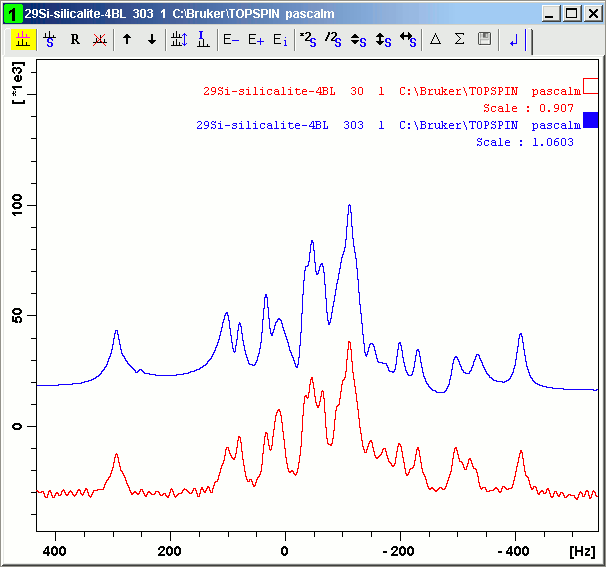
We apply SVD with 20 singular values and then harminv-1.3.1 on one-pulse silicalite 29Si MAS FID signal, acquired with the same conditions as in Figure 20, but NS = 1020.
(F) Harmonic inversion test 3 (zeolite NaY)
We apply harminv-1.3.1 on one-pulse 29Si MAS FID signal of NaY zeolite (its TopSpin file 140.zip, TD (TopSpin definition) = 2048, TDeff = 400, DW (TopSpin definition) = 0.0144 msec, SWH = 34.722 kHz, SI = 32768, NS = 4600, D1 = 10 sec), whose spectrum is shown:
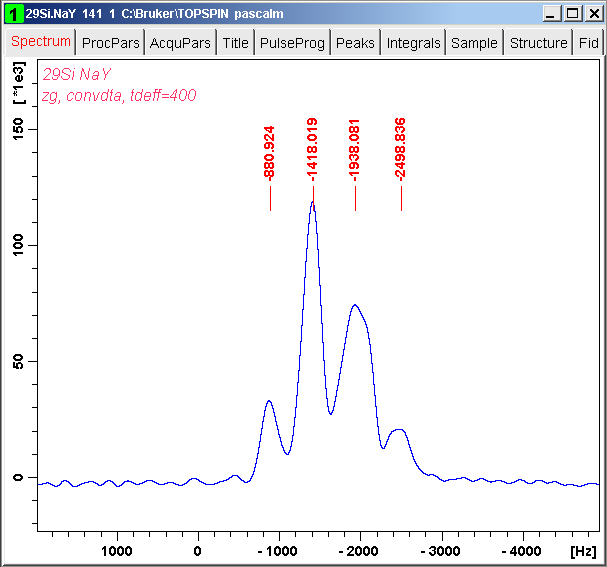
We use the Java application nmrsvd2.jar for denoising one-pulse 29Si MAS FID signal of NaY zeolite. Only TDeff/2 = 200 complex points are involved for this process and ten singular values are used.
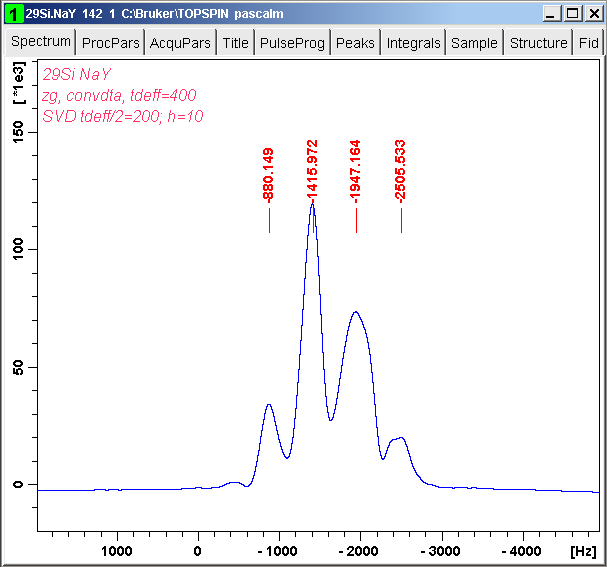
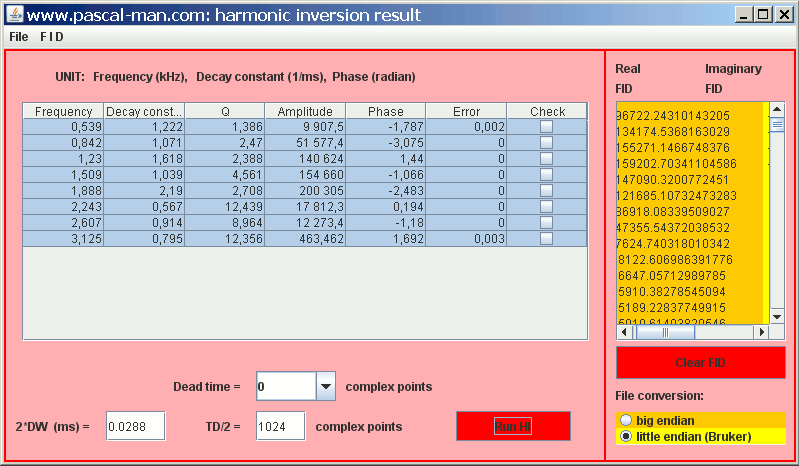
We apply the C program harminv-1.3.1 on the SVD denoised one-pulse 29Si MAS FID signal of NaY zeolite.
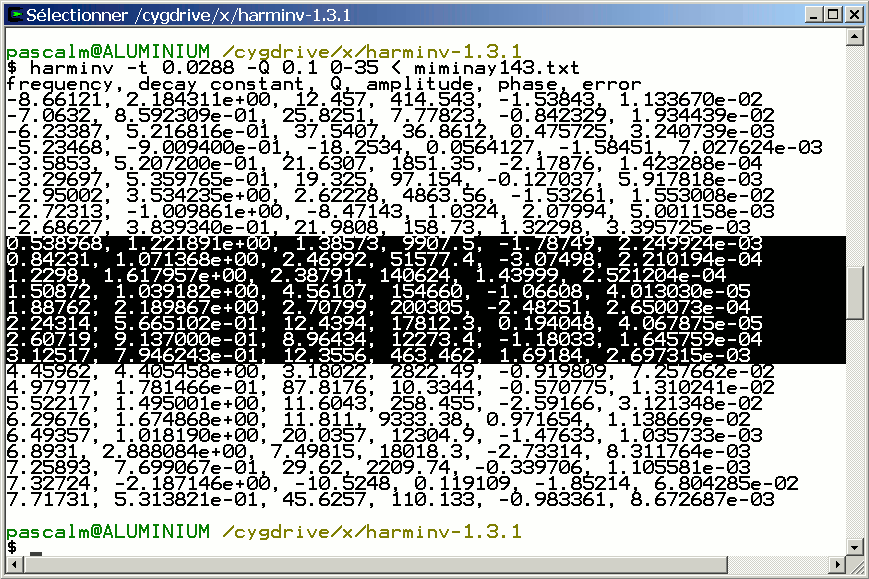
We use the highlighted data for simulating one-pulse 29Si MAS FID signal of NaY zeolite.
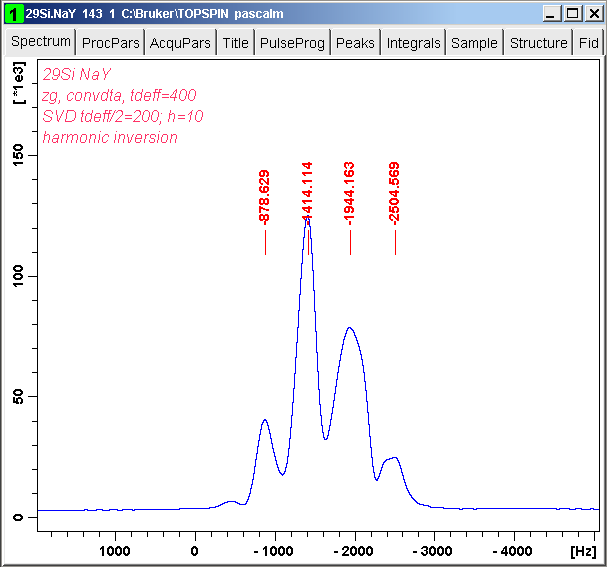
The corresponding spectrum is shown:
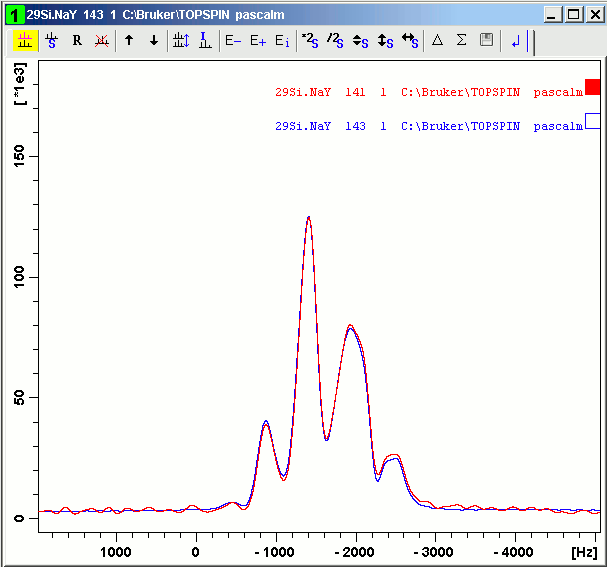
Experimental and simulated spectra are compared:
(G) SUN Java JTable reference
- Berstel Jean: Les tables (PDF file)
- SUN Java: How to use tables
- SUN Java Std. Ed. v1.4.2: All Classes
- SUN Java Std. Ed. v1.4.2: Class JTable
- java-tips.org: Read a data file into a JTable
- Réal Gagnon: Read a data file into a JTable
- dreamincode.net: Best way to create/save JTable
- QuickTable: Swing JTable links
- java2s: JTable Swing Java tutorial
- javalobby.org: A simple interactive JTable tutorial
- baptiste-wicht: Création interface graphique avec Swing : les tableaux (JTable)
- b.kostrzewa: Composant JTable
- ZDNet: Afficher des données à l'aide de la classe Swing JTable
- upmf-grenoble: Swing : table des matières
- laltruiste:
La classe Vector
- Object Definitions Ltd: JTable setRowHeight causes slow repainting
- Sun Developer Network: JTable is not stretched to fill a viewport's height
