We have simulated the same experiment as that described in Example 2 using SIMPSON version 1.1.0, a general simulation program for solid-state NMR spectroscopy provided by M. Bak, J. T. Rasmussen, and N. C. Nielsen, J. Magn. Reson. 147, 296-330 (2000).
*****Simpson 2 for MQMAS*****
# mqp2.in
# spin-3/2 echo amplitude optimization
# with p2 in MQMAS sequence

spinsys {
  channels 23Na
  nuclei   23Na
  quadrupole 1 1 1e6 0 0 0 0
}


par {
  spin_rate        10000
  variable tsw     0.25
  sw               1.0e6/tsw
  np               41
  crystal_file     rep320
  gamma_angles     10
  start_operator   I1z
  verbose          1101
  variable rf      100000
  proton_frequency 400e6
}

proc pulseq {} {
  global par
  maxdt $par(tsw)

  matrix set 1 elements {{4 1}}


  matrix set detect elements {{2 3}}


  acq

  pulse 6 $par(rf) x-pulse


  filter 1


  for {set i 1} {$i < $par(np)} {incr i} {

    pulse $par(tsw) $par(rf) x-pulse


    acq -y

  }
}


proc main {} {
  global par
  fsave [fsimpson] $par(name).fid
  puts "Larmor frequency (Hz) of 23Na: "
  puts [resfreq 23Na $par(proton_frequency)]
}
|
***Comment***File name. Description. Spin I = 3/2. 1st-order quadrupole interaction, qcc = 1 MHz, eta = 0. 10 kHz. 0.25 µs increment 2nd pulse: 10 µs. 100 kHz RF pulse. 0.25 µs increment. -3Q from the 1st pulse, density matrix convention. Central transition, fictitious spin-1/2 convention. No pulse, no signal. The 1st x-pulse has 6 µs duration Select -3Q coherence. 2nd x-pulse is variable pulse. Receiver -y. |
SIMPSON uses gyromagnetic ratios provided by IUPAC for the determination of the Larmor frequency of a nucleus. For example:
23Na Larmor frequency = Proton Larmor frequency * 23Na gyromagnetic ratio / Proton gyromagnetic ratio;
400 MHz * 7.0808493 / 26.7522128 = 105.8731007 MHz.
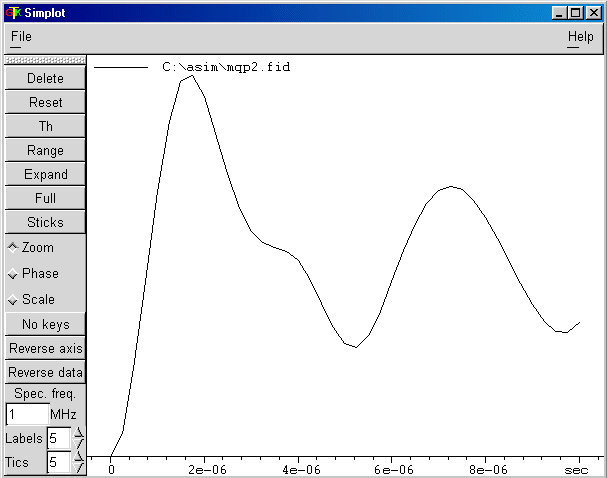
This curve represents the simulated central-transition echo amplitude versus the second-pulse length p2 with SIMPSON for a spin I = 3/2 system excited by the MQMAS sequence.


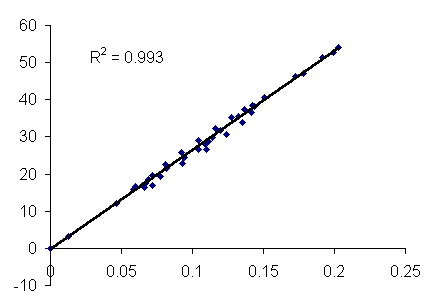
This figure represents the correlation curve relating two simulations generated with SIMPSON (Simpson 2) and JDK1.3 Java applet (Example 2) for the MQMAS sequence applied to a spin I = 3/2 system.
